Accounting for Business Valuation: A Practical Guide for Investors
February 25, 2025
Accounting is an essential tool for understanding the performance of any business. Its function goes beyond simply recording financial transactions, as it provides detailed information on a company's income, expenses, assets, liabilities, and equity. This information is not only vital for assessing the current and past financial situation, but also allows for projecting the future performance of the company under analysis.
Known as the "language of business," accounting is perceived by many as a complex and even tedious discipline. This often leads us to relegate it and focus on more dynamic or creative tasks. I recognize that it is not a simple task; if I had to prepare a company's entire accounting, I probably wouldn't achieve the necessary precision. However, what I do know best is analyzing financial statements to understand the financial situation, identify strengths and risks, and identify potential opportunities.
To achieve this analysis, it's essential to master the three main financial statements , which reflect the "soul" of a company and are key to assessing its economic health. I'm referring to the Profit and Loss Account , the Balance Sheet, and the Cash Flow Statement. But rather than getting lost in technical details, we'll focus on the essentials of each: what they tell us about the company and how they can help us make smarter decisions. Over the next few lines, we'll explore the key aspects of these financial statements and how to extract valuable information from them.
I'm not trying to help you become an accounting expert. My goal is to help you acquire the tools you need to distinguish between a solid business and one that's struggling or showing signs of decline.
In the world of finance, transparency is essential. Publicly traded companies are required to undergo audits and report their results quarterly and annually. Through these reports, accounting provides clear data on revenue, expenses, assets, liabilities, and other key indicators, facilitating an accurate view of the company's financial situation. This information is not only useful for valuing a company, but also allows its performance to be compared with that of others in the same industry or sector, identifying those that are better positioned or have superior performance.
On the other hand, accounting is a powerful tool for risk detection. Proper accounting analysis can reveal warning signs, such as high debt levels or liquidity issues, allowing you to anticipate potential problems before they become crises. With this understanding, you will be better prepared to make more informed and strategic decisions about the companies you wish to evaluate.
How financial statements reflect the health of a business
Financial statements are fundamental tools for analyzing and understanding a company's financial performance. They systematically record all economic movements that reflect the company's activity: from income inflows to expenses and debt payments, the assets it owns, obligations it must meet, and its equity. These documents not only provide a snapshot of the past but also serve as a basis for projecting the future and making decisions to assess whether a potential investment is profitable or not.
As I mentioned earlier, financial statements are made up of three key reports:
Profit and Loss Accounts: Records income and expenses for a given period, showing how much money the company is earning.
Balance sheet: It shows the company's financial situation at a given point in time. It tells us what the company owns and owes. It tells us whether it has a lot of debt or little. In short, it tells us whether it's likely to go bankrupt.
Cash flow: It tells us what the company does with the money it earns each year. The company can reinvest in the business, acquire other companies, pay down debt, pay dividends, or repurchase shares.

What are we interested in knowing from these reports?
How to analyze each financial statement to detect opportunities and risks.
Which accounting metrics are most relevant to investors?
How to calculate key ratios in investment
Common mistakes when evaluating companies and how to avoid them.
Financial statements
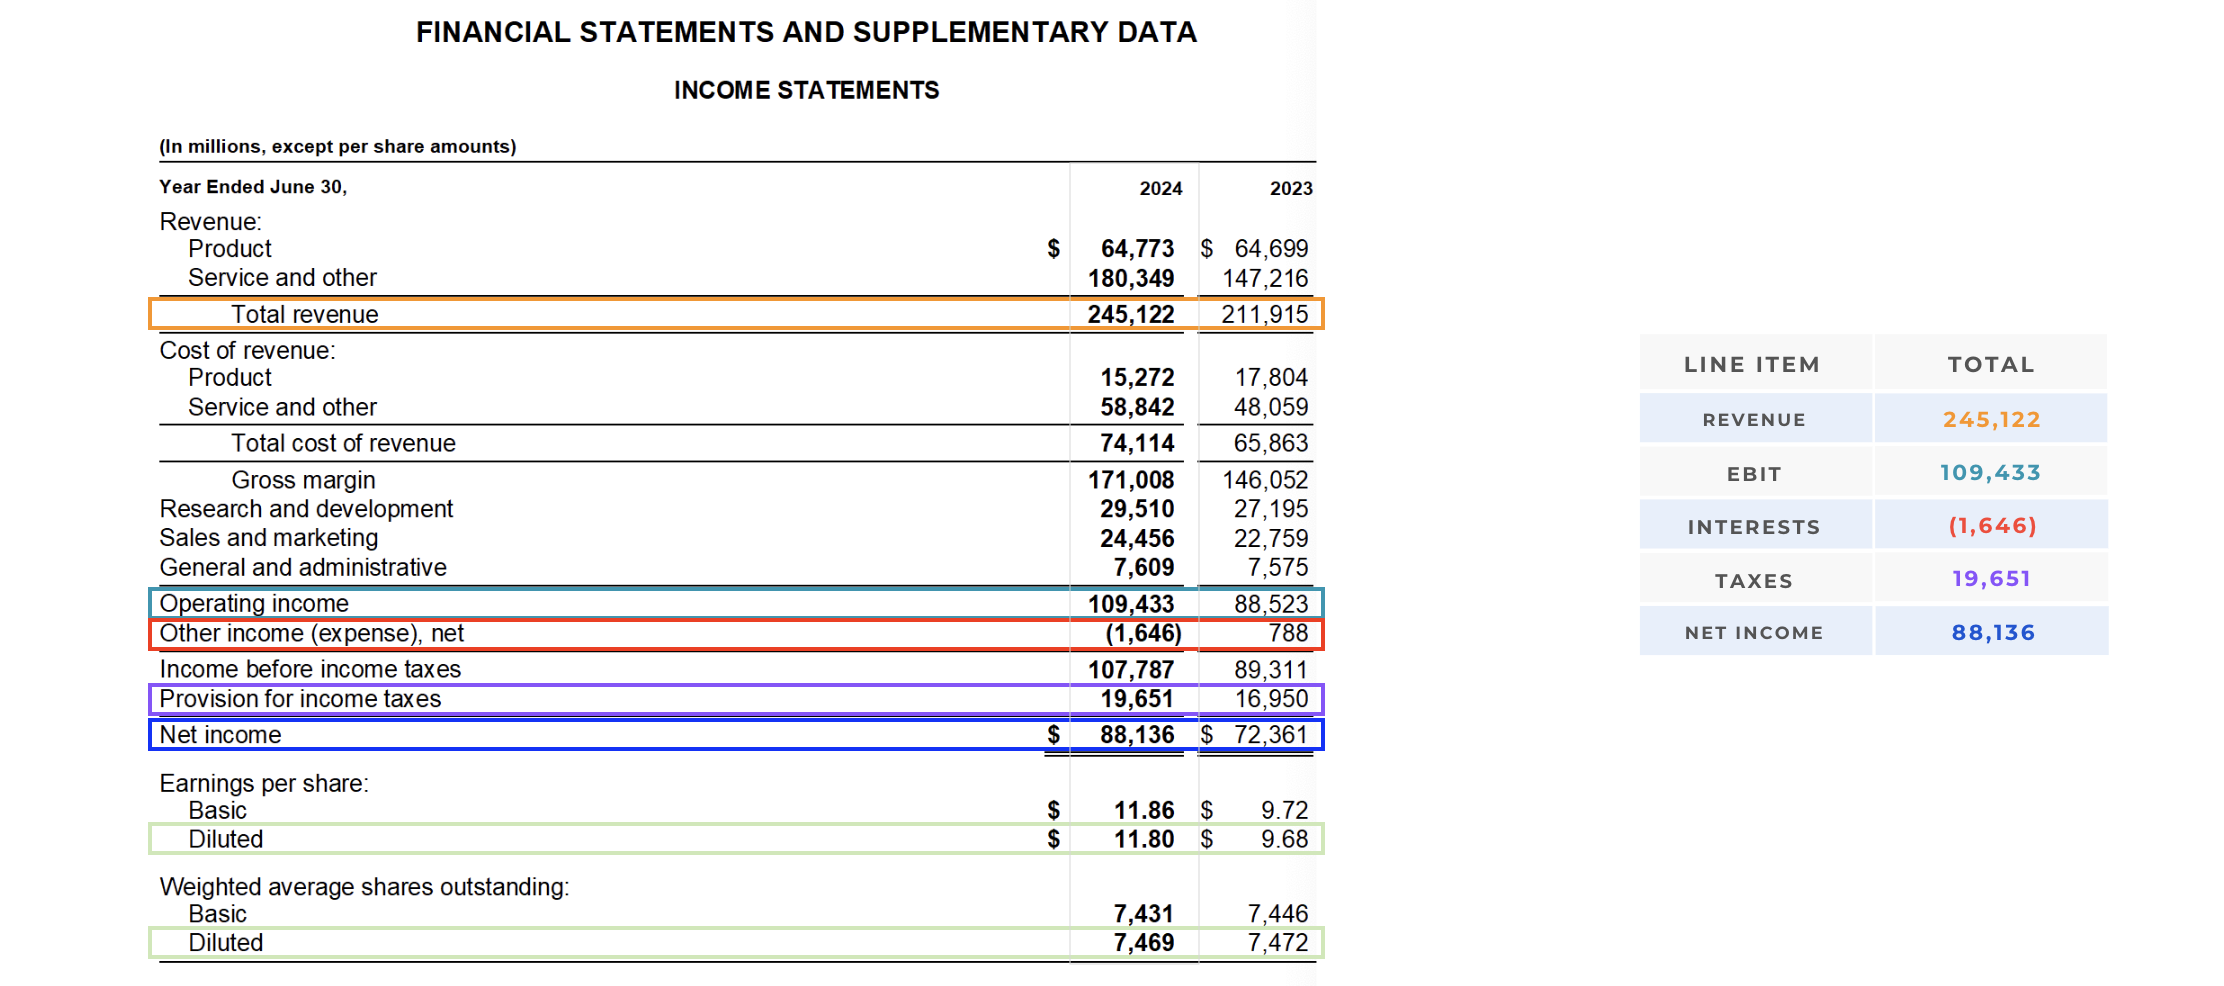
We'll analyze each of the financial statements and highlight the key items in each. To illustrate this in a practical and real-life way, I'll use the accounts of Microsoft Corporation (MSFT) as of June 30, 2024 , the date the company closes its fiscal year (figures in millions of dollars).

1) Profit and Loss Accounts (Income Statements)
He tells us:
How much money is the company making?
From here we are interested in knowing:
Revenues : Money generated from sales of products and services
EBIT or Operating Income: Earnings before interest and taxes
Interest : Interest that the company pays on debts or earns on investments
Taxes : Corporate taxes
Net Income : Profit or loss remaining after deducting all expenses.
Microsoft Corporation (MSFT)
Figure in Millions USD
2) Balance Sheet
He tells us:
What the company owns and owes.
Assets : Everything the company owns (cash, inventory, property).
Liabilities : Everything you owe (loans, accounts payable, etc.) .
Equity : Company's own capital (shareholders )
Assets = Liabilities + Net Worth
From here we are interested in knowing:
Debt situation (debt or net cash) = Total cash - Debt
Short- and long-term debt that pays interest
Returns on capital (ROIC, ROCE)
Microsoft Corporation (MSFT)

3) Cash Flow Statement
He tells us:
What does the company do with the money it earns:
Cash from Operations: Money generated by the company's core business.
Cash from Investing: Purchases or sales of assets such as machinery or property.
Cash from Financing: Loans, dividend payments, share issuance.
From here we are interested in knowing:
Depreciation and amortization (M&A)
Investments in maintenance and growth (CAPEX)
Acquisitions of other companies (Acquisitions)
Dividend payment (Dividends paid)
Share repurchases (Common stock repurchased)
Microsoft Corporation (MSFT)

Metrics, ratios and key data for analysis
From these three financial statements—the Income Statement , the Balance Sheet , and the Cash Flow —key metrics and ratios are derived that enable a comprehensive analysis of companies.
By identifying the most relevant items, it's possible to perform calculations that provide deeper insight into financial performance. These metrics allow for evaluating profitability, liquidity, operational efficiency, and capital structure, providing the tools to make informed decisions about the company.
Some of the most important metrics, ratios, and data we need to know when valuing companies are:

1. ROIC (return on invested capital)
ROIC (Return on Invested Capital) is one of the best indicators for evaluating the profitability of a business. This metric measures how efficiently a company uses the capital provided by investors to generate profits. Essentially, ROIC reflects a company's ability to convert capital investments into sustainable and profitable returns. In other words, how efficiently a company uses all its assets (factories, personnel, investments, etc.) to generate money for its shareholders. It can be viewed in the same way that a fund manager is able to generate a return on a shareholder's investment. For example, if a company's ROIC is 20%, it means it generates €20 in returns for every €100 of invested capital. Unlike ROE, ROIC takes into account the company's debt, which is why it is a more realistic metric when analyzing business profitability. The higher the ROIC, the more likely you are to have found a good company. (>15% can be considered an optimal ROIC, of course it will depend on the sector)
Calculation: The data comes from the Balance Sheet . 1) First, we calculate the debt or net cash. 2) Then we calculate the Invested Capital with Goodwill = Equity + net debt (- net cash). 3) Finally, we obtain the ROIC by dividing the EBIT by the Invested Capital (we will use Microsoft's accounts):
Microsoft Corporation (MSFT)
1) Cash or net debt = Cash and banks (Cash And Equivalents) - Financial debt
Net debt = 22,140
2) Invested Capital with Goodwill = Equity + net debt (- net cash)
Capital Invested c/Goodwill = 290,617
3) ROIC= (EBIT / Invested Capital) x 100
ROIC= 37%
How to interpret it: It can be compared to the company's own track record, the average for its sector, or even the stock market average, which is typically around 14%. Microsoft has a much higher ROIC than the stock market average and many companies in its sector. It also tells us that for every $100 the company invests, it generates $37 in returns . Microsoft undoubtedly generates considerable returns, a product of sound capital management and a strong competitive advantage.
2. ROE (Return on Equity) or return on invested capital.
ROE (Return on Equity) measures the return a company generates on the capital contributed by its shareholders. In other words, it indicates how much profit is obtained for every dollar invested by shareholders . ROE allows us to evaluate how efficiently a company uses its equity to generate profits. The higher the ROE, the better the performance from the investor's perspective. ROE does not take into account the company's debt.
Calculation: Data comes from the Balance Sheet . It is calculated by dividing net income by equity:
Microsoft Corporation (MSFT)
ROE = (Net profit / Shareholders' equity) x 100
ROE= 88,136 / 268,477
ROE= 32%
How to interpret it: ROE is very useful for comparing companies within the same industry or sector, as it can reveal which companies are best utilizing their resources to achieve profitability. A consistently high ROE is usually indicative of good business management and a solid strategy. A very high ROE can be a double-edged sword if it's driven primarily by a high level of debt, as this can increase financial risk. In Microsoft's case, the company has a fairly considerable ROE of 32%, which indicates good equity management. It tells us that for every $100 invested by partners and shareholders, it earns $32.
3. ROA (Return on Assets) or return on assets.
Return on assets (ROA) is a financial ratio that indicates a company's profitability relative to its total assets. It determines how efficiently a company uses its resources to generate profit. In other words, how much the company is generating for each dollar it has working. It's more accurate to compare ROA between companies in the same industry, since they operate with similar asset structures. The higher the ROA figure, the better, because the company can earn more money with a smaller investment. A higher ROA means greater asset efficiency. Unlike ROE, this ratio does take into account debt (assets financed by debt).
Calculation: It is calculated by dividing the net profit (Net Income) by the total assets (Total assets):
Microsoft Corporation (MSFT)
ROA: (Net Profit / Total Assets) x 100
ROA= 88,136 / 512,163
ROA= 17%
How to interpret it: A higher ROA means a company is more efficient and productive in managing its balance sheet to generate profits. ROA varies greatly depending on the sector of the company being analyzed. A food company typically has a lower ROA than a technology company. For this reason, it's better to compare a company's ROA with its previous ROA figures or with the ROA of a similar company when using it as a comparative measure. In this case, Microsoft tells us that for every $100 of resources the company uses to operate, it earns $17.
4. Debt ratio
Companies need to operate with debt to grow and innovate, but to what extent? This depends greatly on the sector. A construction company will need a much higher level of debt to launch its business than a distribution company.
Debt levels can be analyzed from two perspectives: Net Debt/Equity and Net Debt/EBITDA . Depending on the type of business and its financial structure, one metric may be more relevant than the other for assessing its debt level and repayment capacity.
Calculation:
Microsoft Corporation (MSFT)
Net Debt (Total Debt) / Net Equity (Equity)
18,648 / 268,477
0.07x
How to interpret it: When the ratio is greater than 1, it indicates that debt exceeds net worth (equity). When this ratio is less than 1, it indicates that the company has more equity than borrowed capital.
Calculation:
Net debt/EBITDA
18,648 / 131,720
0.14x
How to interpret it: A net debt/EBITDA ratio above 3x can be dangerous. The debt/equity ratio is generally used in financial companies because such debt is backed by the company's own assets; assets have a fairly defined value. This ratio should not exceed 4x for these types of companies.
5. Liquidity ratio
The liquidity ratio measures a company's ability to meet its short-term obligations using its current or liquid assets (cash, money in the bank, stocks, bonds, and other financial securities). It is key to assessing short-term solvency and avoiding liquidity problems.
Calculation: Divide current assets by current liabilities. Figures in millions of dollars, except for the result.
Microsoft Corporation (MSFT)
Liquidity ratio = Current assets / Current liabilities
Liquidity ratio = 159,734 / 125,286
Liquidity ratio = 1.27
How to interpret it: A value above 1 indicates the company has sufficient liquid assets to cover its short-term debt, while a value below 1 could indicate liquidity problems. Microsoft has a liquidity ratio above 1, meaning it has sufficient liquid assets to cover its debt.
6. Book value per share
Book value per share (BVPS) is a financial metric that represents a company's theoretical value per share if all its assets were liquidated and all its debts paid. It is obtained by dividing the company's net worth by the number of shares outstanding.
Calculation: Divide net worth by the number of shares. All figures are in millions of dollars, except for the result.
Microsoft Corporation (MSFT)
BVPS = Net worth / number of shares outstanding
BVPS= 268,477 / 7,469
BVPS= $26
How to interpret it: Typically, the BVPS is lower than the stock price because the market is valuing the company above its book value, which usually indicates expectations of future growth. If the opposite were true, the company could be undervalued or facing financial difficulties.
7. EPS (Earnings per share)
Earnings per share (EPS) is one of the most important metrics in company valuation, especially for investors. EPS measures how much net profit a company generates per outstanding share, making it a key indicator for assessing a company's profitability from a shareholder's perspective.
Calculation: It's calculated by dividing the company's net income, which in Microsoft's case was $88.136 billion in 2024, by the number of shares outstanding, which was 7.469 billion, giving us earnings per share of $11.80. If you go to any financial website, the result should be the same.
EPS = Net profit / number of shares
EPS = 88,136 / 7,469
EPS= $11.80
How to interpret it: In the stock market, the most important thing is the future, so it's essential to be able to anticipate where the company could be in the coming years. For this reason, it's crucial to estimate a company's future EPS and thus know whether what we're paying for a share today is a fair or excessive value.
If we estimate Microsoft's EPS to be $15.50 in 2 years (2026), at an average P/E multiple of 30x over the past 5 years, we get a forward price per share of $465, and it's currently trading at just $400. Today, we're buying a share for less than its future value.
Future EPS = $15.50
Multiple Price / Earnings = 30x
Estimated price for net profit = $465
Estimating future EPS (Earnings Per Share) is one of the most important, but also one of the most subjective, tasks for investors. Since what really matters in the stock market is the future, not the past, this estimate requires more than simple numerical calculations: it demands a thorough analysis. A qualitative assessment of the company is necessary, considering strategic and operational factors, a topic I address in greater detail here.
If you want to know more about valuation multiples, you can visit this link .
8. Free Cash Flow
Warren Buffett calls it the owner's return, and it's one of the most important and widely used metrics for investors. Free cash flow (FCF) is a much cleaner and more realistic profit for a company, discounting a number of factors that net income doesn't take into account. There are different ways to calculate it; some take operating cash flow and subtract capex, but to further refine it, the following formula is more precise.
Calculation : The calculation consists of starting with the EBITDA (profit) and then subtracting CAPEX from investments, interest payments and taxes.
FCF = EBITDA - CAPEX - Interest - Taxes
FCF= 131,720 - 44,477 - 1,646 - 19,651
FCF= 65,946
To obtain the FCF per share, simply divide the FCF by the number of shares:
FCF per share = FCF / number of shares
FCF per share = 65,946 / 7,469
FCF per share = $8.82
How to interpret it: In this case, the net profit (88,136 million) is higher than the FCF (65,946 million) because the company is reinvesting capital for the adoption of AI and requires high CAPEX spending, especially in recent years.
An estimated FCF per share of $11, with a P/FCF multiple of 35x, gives a target price of $385 per share, a figure that is considerably more conservative than the P/E ratio.
Future FCF = $11
Multiple P/FCF = 35x
Estimated price by FCF = $385
When analyzing the stock based on net income, with an estimated price of $465, it appears cheap at the current price (price of $400 in February 2025), suggesting a potential upside of 16%. However, if we use free cash flow (FCF) as a valuation criterion, the picture changes: the target price of $385 is lower than the current price of $400, indicating potential downside risk. In this case, it is more prudent to consider the FCF-based target price, as it offers a more conservative valuation adjusted to the company's financial reality.
Conclusion : If the company's growth remains unchanged, buying does not offer an adequate margin of safety. In that case, it is preferable to wait for the market to create an opportunity through a possible drop in the stock price before investing.
Present and past
Evolution of the figures
Now that we know where the ratios and metrics calculated above come from, it's essential to look back and see how these numbers have evolved. The table below shows Microsoft's evolution over the past nine years, with sustained growth in revenue, EBIT, net income, and free cash flow, accompanied by increasingly solid margins.
During the period under review, sales increased from nearly $92 billion to more than $245 billion, reflecting the company's ability to expand its customer base and diversify its business lines. EBIT, which measures operating performance, has also grown consistently, as have its margins, reflecting efficient cost management and a sound commercial strategy.
A high EBIT margin indicates that a company has a significant competitive advantage. In Microsoft's case, its operating margin has grown from 30% in 2016 to 44% today, reflecting improved efficiency and profitability. This sustained increase is a clear sign that the company is not only optimizing costs but also maintaining a solid position against its competitors, consolidating its industry leadership. (red line)
Normalized net income and EPS (earnings per share) are on an upward trend, demonstrating that the value generated by the company is being passed on to its shareholders. Finally, free cash flow has increased significantly, confirming Microsoft's ability to finance its growth, cover its obligations, and compensate its shareholders without relying on external sources of financing.
Overall, this positive evolution in key financial indicators underscores Microsoft's strength and stability, as well as the effectiveness of its strategic decisions over time.
Future
The past and present are very important in investment analysis, but what really matters in the stock market is the future , and this is where the art of investment lies: being able to visualize how the company will perform in the coming years. Obviously, this isn't an easy task because no one has a crystal ball to predict the future and what will happen to the company, but current and past numbers can give us a guide to the company's possible evolution.
Not everything is a matter of numbers; other qualitative factors will also influence this, such as a new product that impacts the market or expansion into a new market, the management of the executive team, capital management, competitive advantages, etc. These are factors we must consider and be aware of when this happens.
Continuing with our Microsoft example, the future outlook is encouraging, given the strong rise of artificial intelligence (AI) and the increasing need for companies to implement this advancement to maintain their advantage over their competitors.
Microsoft's sales are expected to continue growing at a rate of 14% over the next three years, with EBIT at 45%, Net Income at 35%, and Earnings per Share EPS at 15%.
Microsoft's 3-year future growth:
Sales: 14%
EBIT: 45%
Net profit: 35%
EPS: 15%
If we project this growth, we find a company that will be billing by approximately 2027:
Sales: 360 billion
EBIT: 160 billion
Net profit: 131 billion
EPS: $17
Since a company's fundamentals are sooner or later reflected in its stock price, Microsoft's stock market shouldn't plummet. On the contrary, as long as the environment remains stable, the company should continue its upward trend.
How to interpret it:
Once we've projected the company's growth and analyzed its key metrics, we can estimate a possible future stock price. In short, we've observed that Microsoft has:
A high ROIC , which indicates efficient use of capital and company quality.
Furthermore, its debt level is low, with a Net Debt/Equity ratio well below 1 and a Net Debt/EBITDA of just 0.14x, meaning it does not face any debt problems .
This is coupled with constantly growing earnings per share (EPS) .
And most importantly, solid free cash flow (FCF) generation .
To project a future price, we can use various profit metrics. In this case, we'll use EPS, as it better reflects the company's performance.
With a forward EPS of $17 and a valuation multiple of 30x, based on the historical average over the past five years, the estimated stock price could reach $500 in three years. Considering the current price of $400, this implies a potential return of 8% CAGR (compound annual return) over three years. In other words, for each share purchased, the investor would earn a profit of $100 in three years.
Conclusion:
All the calculations and analyses performed throughout this article have allowed us to see that we are likely looking at a quality stock at a good price, a basic principle of value investing.
I hope you find this article helpful. If you liked it, please feel free to leave a comment.
Have you used accounting to value companies? Share your experience in the comments.
This analysis is not a recommendation to buy or sell; it is my personal opinion, and each person should conduct their own analysis of the company.
"Until next time—make your money work for you!"